Data Processing and Microbiome Profiling
Correct data processing is just as important as sequencing!
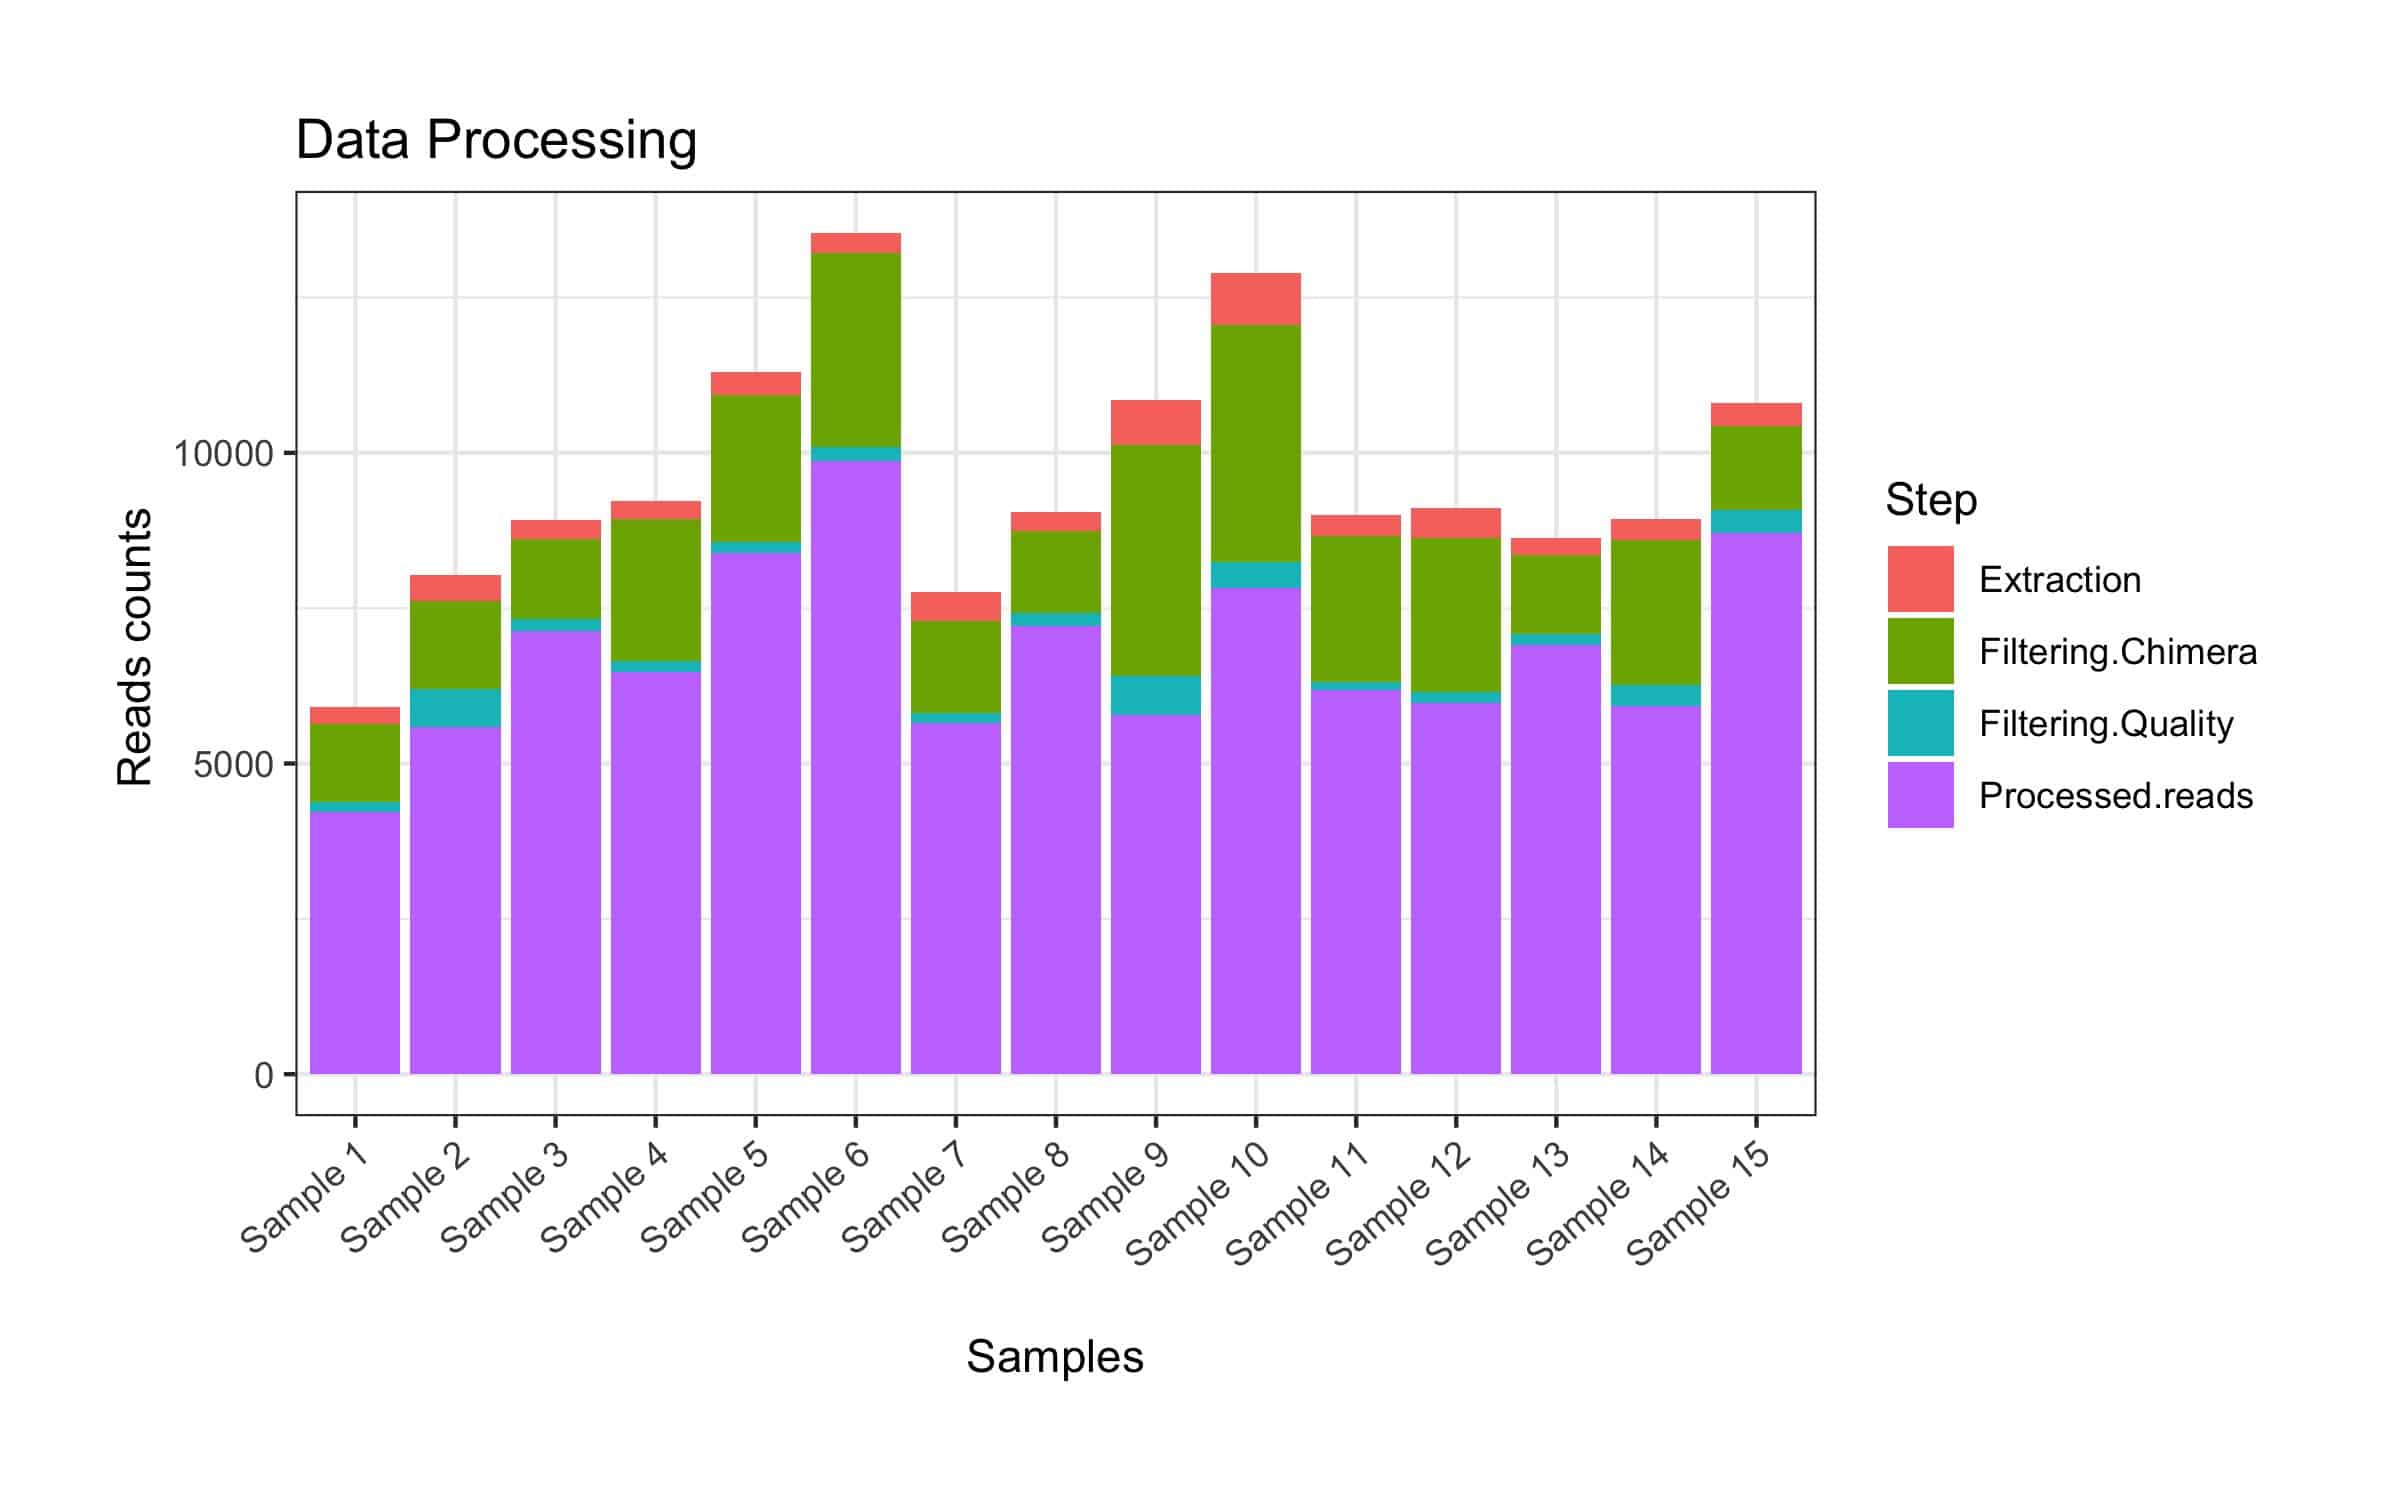
All raw sequencing data must be processed before microbiome profiles can be generated and biologically relevant information can be obtained. This includes evaluation of the data quality and filtering of low-quality data.
After performing quality filtering of the sequencing data, it is time to generate the microbiome profiles. A taxonomic microbiome profile contains information on which taxa are found in the community and their relative abundances*.
If shotgun metagenomic sequencing is used (and not amplicon sequencing), it is also possible to profile the functional capacity of the microbiome community. This provides information on the individual genes found in the community and an estimate of the functional pathways they contribute to.
*If a spike-in solution is included in the sequencing, absolute abundance taxonomic profiles will be generated and analyzed alongside the relative abundance data.

Solving your microbiome problems
We have more than +7 years of experience in analyzing microbiome data and structuring microbiome projects. Our team has worked on more than 75 microbiome projects spanning research, universities and commercial industries.
Biomcare offers both microbiome services for small discovery projects, as well as large custom-designed microbiome projects.
Contact us today and get a quote. We are standing by to service you.
What we do
Data processing and quality evaluation
- Evaluate the quality controls where applicable
- Evaluate the quality of the raw sequencing data
- Filter the data based on the quality evaluation. Quality filtering include removal of (i) adaptors, (ii) low quality data and (iii) contaminants and host reads (where relevant)
Microbiome profiling
- We take quality filtered data and generate microbiome profiles. The specific software and reference data we use depend on the type of data. For example, different software solutions are used to profile 16S and shotgun metagenomic data, and different software and/or reference data will be used to profile stool, saliva or soil samples. The decisions we make also in part depend on the goal of the project, such as the selection of marker-based or assembly-based approaches for shotgun data.
What you get
For each project, a private project folder is made available on the Biomcare server, where all resulting data, statistical results, illustrations, reports, etc. are available for download.
Data
- Quality filtered data in fastq format
Microbiome profiles
- Taxonomic profiles for amplicon data
- Taxonomic and functional profiles for shotgun data
Diversity measures
- Alpha diversity (including observed and extrapolated species/genera richness).
- Beta diversity
Illustrations
- Illustrations that support data evaluation and further analysis decisions. The illustrations include ordination plots and stacked bar plots.
Reports
1) Data Quality Report, including:
- A description of the data quality
- Details of the performed quality filtering.
- Illustrations that support an easy overview of reads/base pairs removed at different steps and number reads remaining post-filtering.
2) Microbiome Profile Report, including:
- Details of the microbiome profiling performed
- Explanations of the provided tables and illustrations
- Summary of our evaluations and considerations (e.g. do we see potential issues, how we suggest samples and taxa should be filtered in further analyses)
Personal guidance and communication
A key factor for successful outcomes of every project is communication. Every project is different, and good personal communication allows us to understand exactly what our customers wish to achieve. This is especially essential when we design the statistical analysis and incorporate customer-provided information. We typically have the most active communication at the beginning when samples are being collected and shipped, and then again when statistical analysis is initiated, and results start to emerge. At the end of the project, we present the project results in an online or face-to-face meeting, depending on geographical circumstances and project size/complexity.
The communication was swift and the samples rapidly analysed.
Address: Hørretvej 17, 8320 Mårslet, Denmark
VAT: DK39122693
E-mail: info@biomcare.com
Phone: +45 3157 2081